

Designing the block canvas analysts use to automate bank operations
DataFlow — the workflow canvas at the heart of a low-code platform for banks
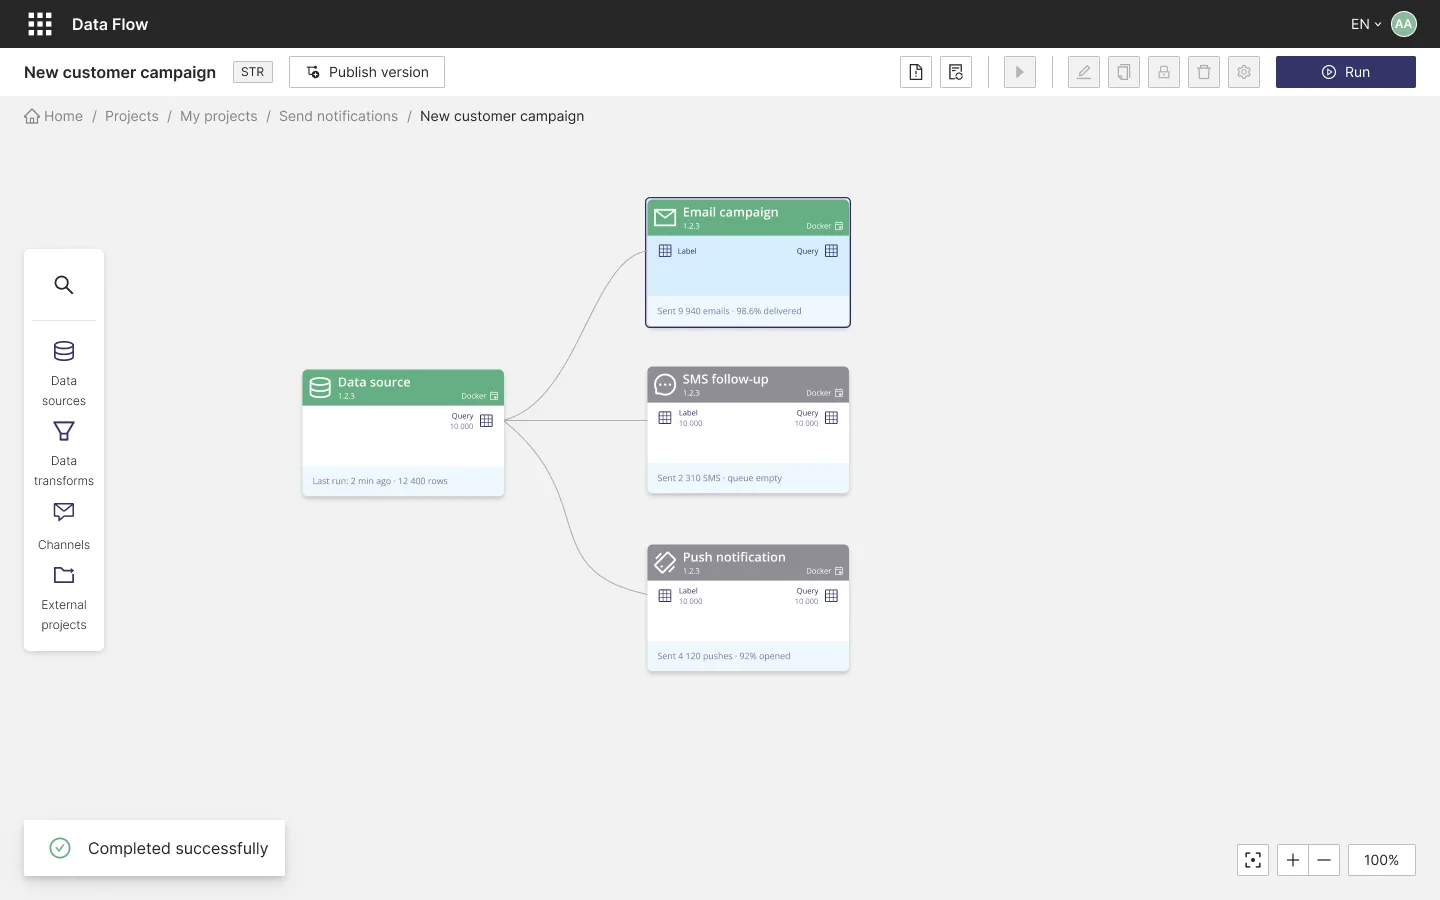
DataFlow is an anonymized name for the platform and the company that built it. Interface text is translated to English and client names are anonymized; the research sketch is redrawn and translated from the Russian original.
DataFlow is a low-code automation platform for banks, and the canvas is where that promise has to actually work: a bank's own analysts — not engineers — assemble automations out of blocks, connect them into a flow, run it, and watch it execute against real operations. Everything else in the product exists to serve this screen.
I designed the canvas experience end to end: how analysts find blocks, how a flow reads while it runs, and how changes to a live automation stay safe. This case pairs with my design system case — the node components documented there are the same ones doing the work here.
- A graph editor for people who don't write code. Node canvases are developer territory — ETL tools, CI pipelines. Our users are operations analysts. Every interaction had to be learnable from the screen itself, not from a manual.
- A flow you can read at a glance. A running automation with dozens of nodes has to answer instantly: what's running, what failed, and where. If the analyst has to open each node to find out, the canvas has failed.
- Editing something that's live. These flows move real money and real customer data. Changing a running automation needed guardrails — versions, view-only access, and clear rules about what can be touched when.
The business promise of a low-code platform is that automation stops being an engineering request and becomes an analyst's everyday work. The design task, then, was to make assembling an automation feel closer to arranging cards than to programming — while keeping the seriousness a banking tool owes its users. Those two pulls, approachability and safety, shaped every decision on this screen.
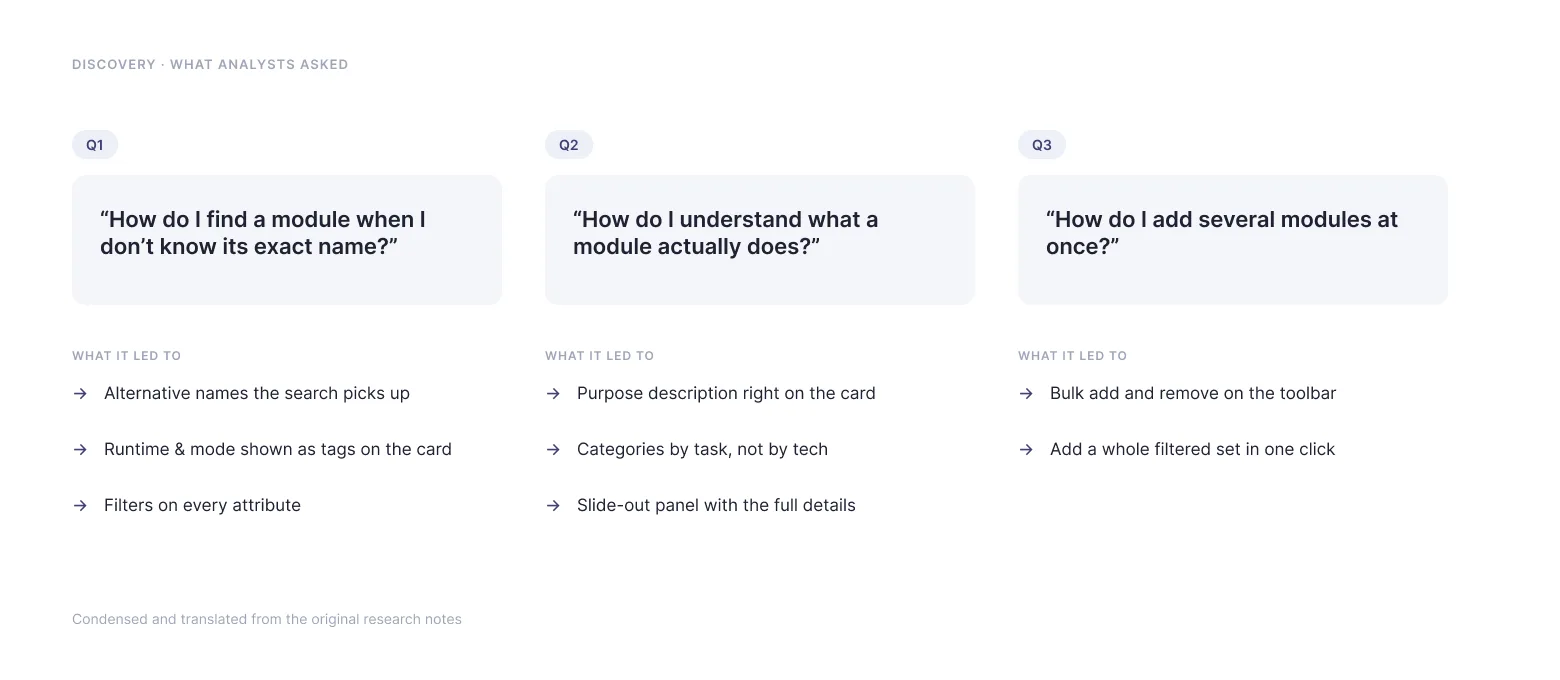
Before any layouts, the module library got a research pass. I collected what analysts actually struggled with and it condensed into three questions — how do I find a module when I don't know its name, how do I understand what it does, and how do I add several at once. Each question ended up with a design answer you can point at in the shipped product.
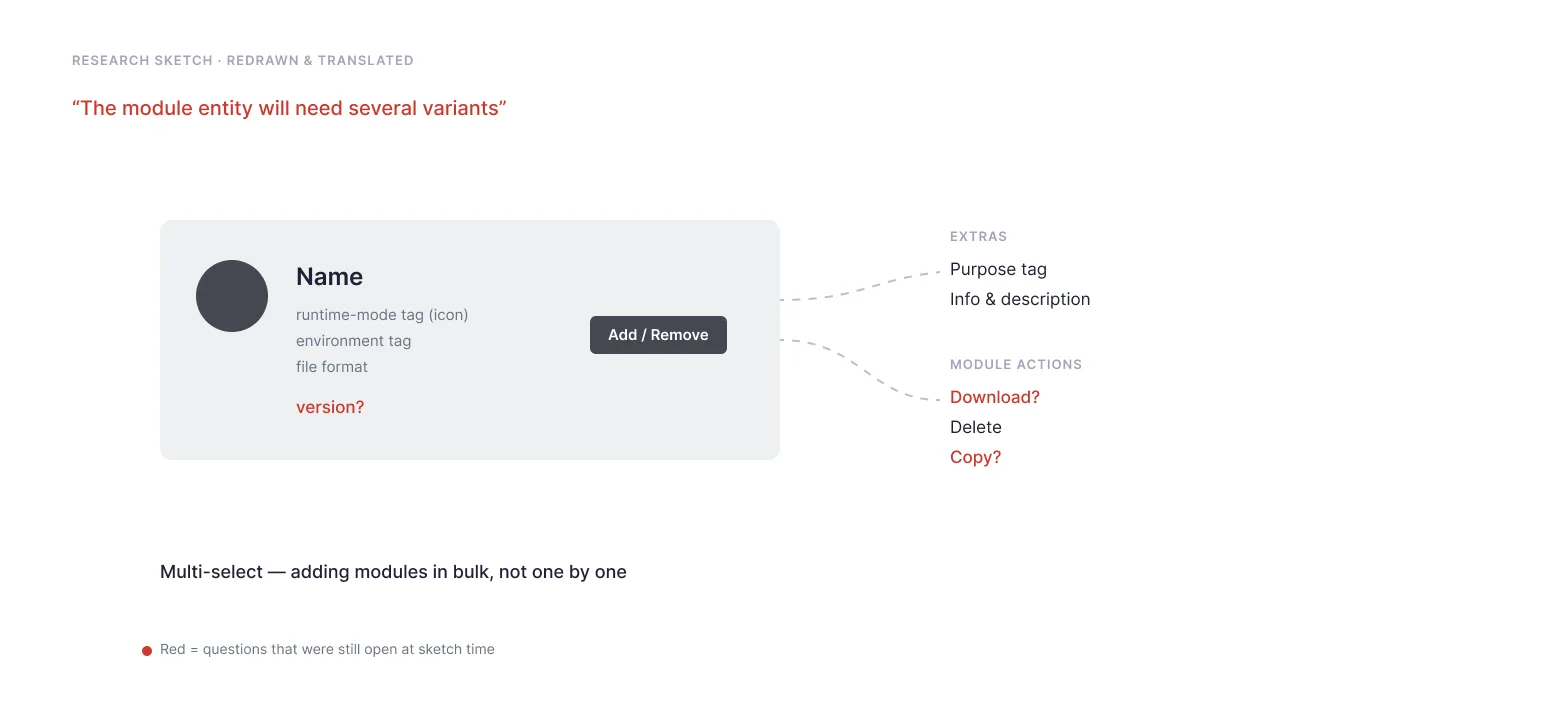
The first artifact wasn't a layout either — it was a sketch of the module card itself, with the open questions written straight onto it: version? download? bulk-select? Redrawn and translated below; the red items were still undecided at sketch time.
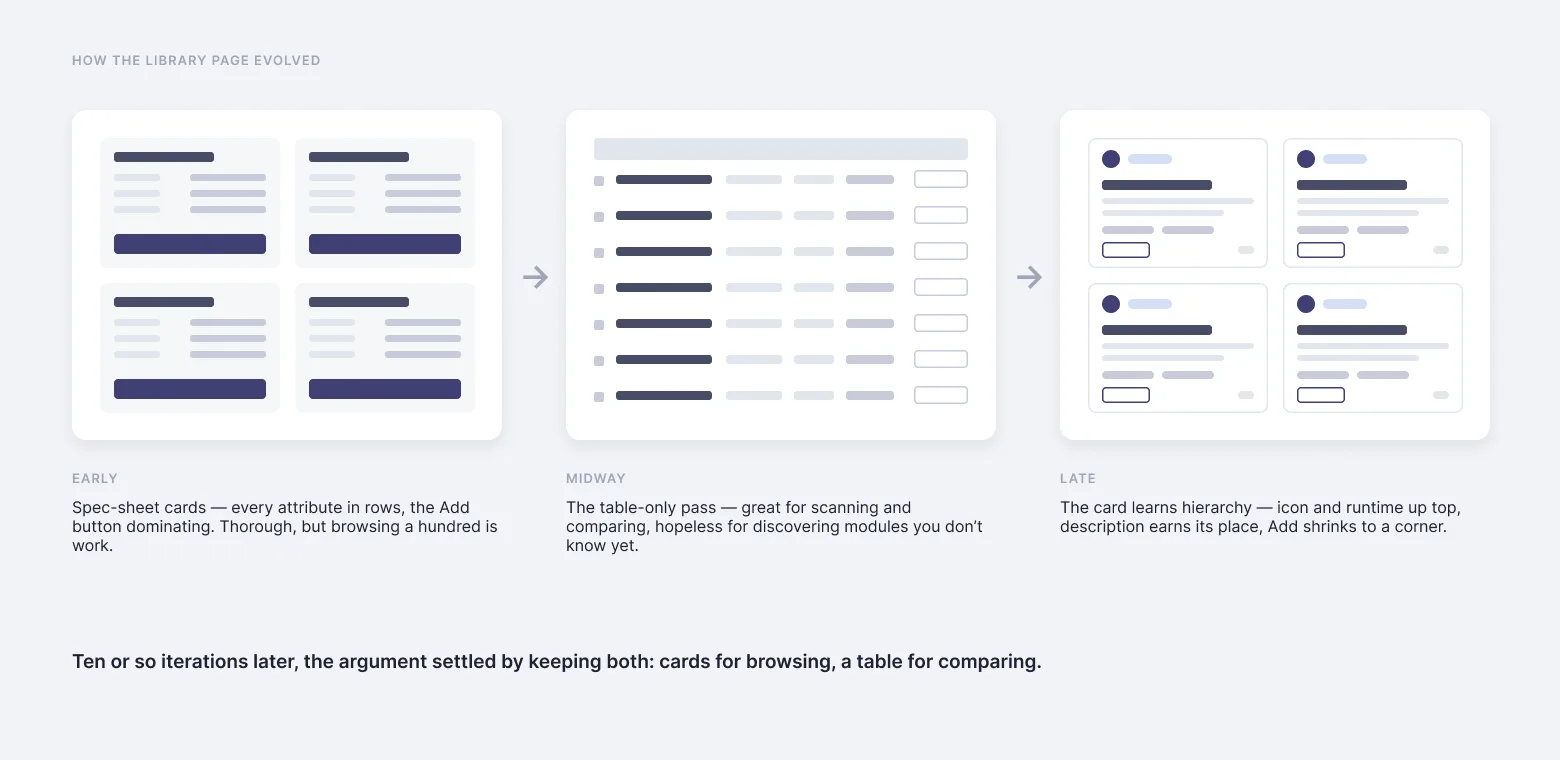
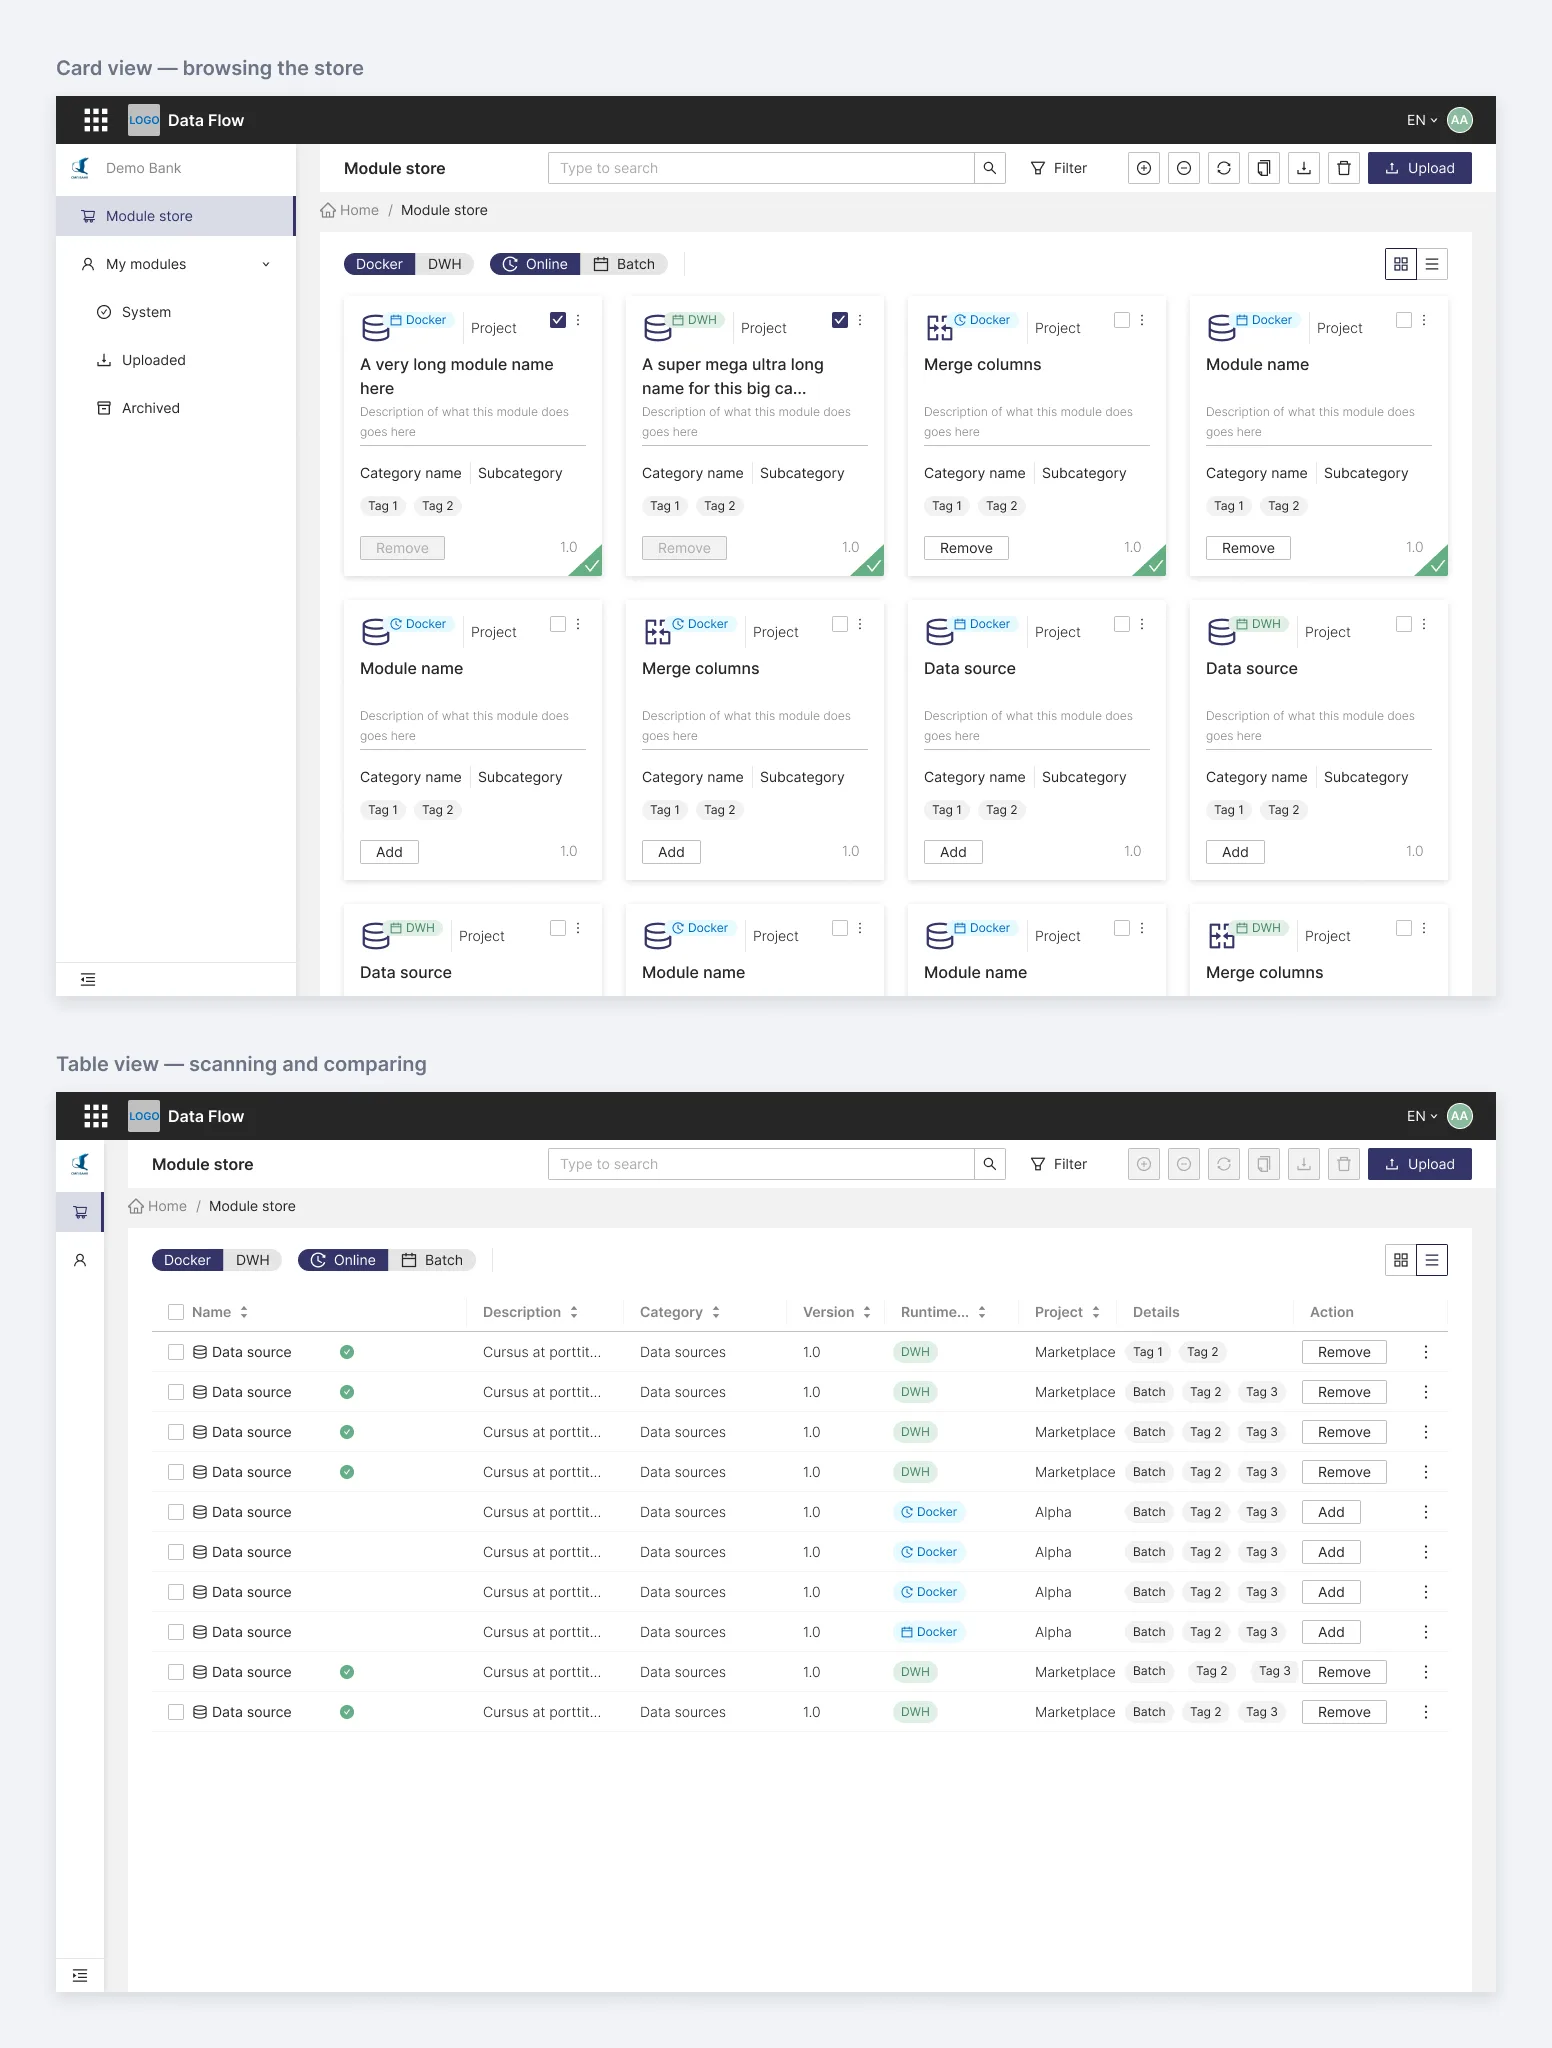
It took around ten layout iterations to accept that browsing and comparing need different layouts — cards for the first, a table for the second. Sketched above in three stages; the shipped catalog simply includes both.
The shipped answer separates the module store from the analyst's own set, and gives the catalog two deliberate views: cards for browsing when you don't yet know what you need, and a table for scanning and comparing when you do. Bulk add and remove live on the toolbar, so stocking a project with blocks takes seconds, not clicks per module.
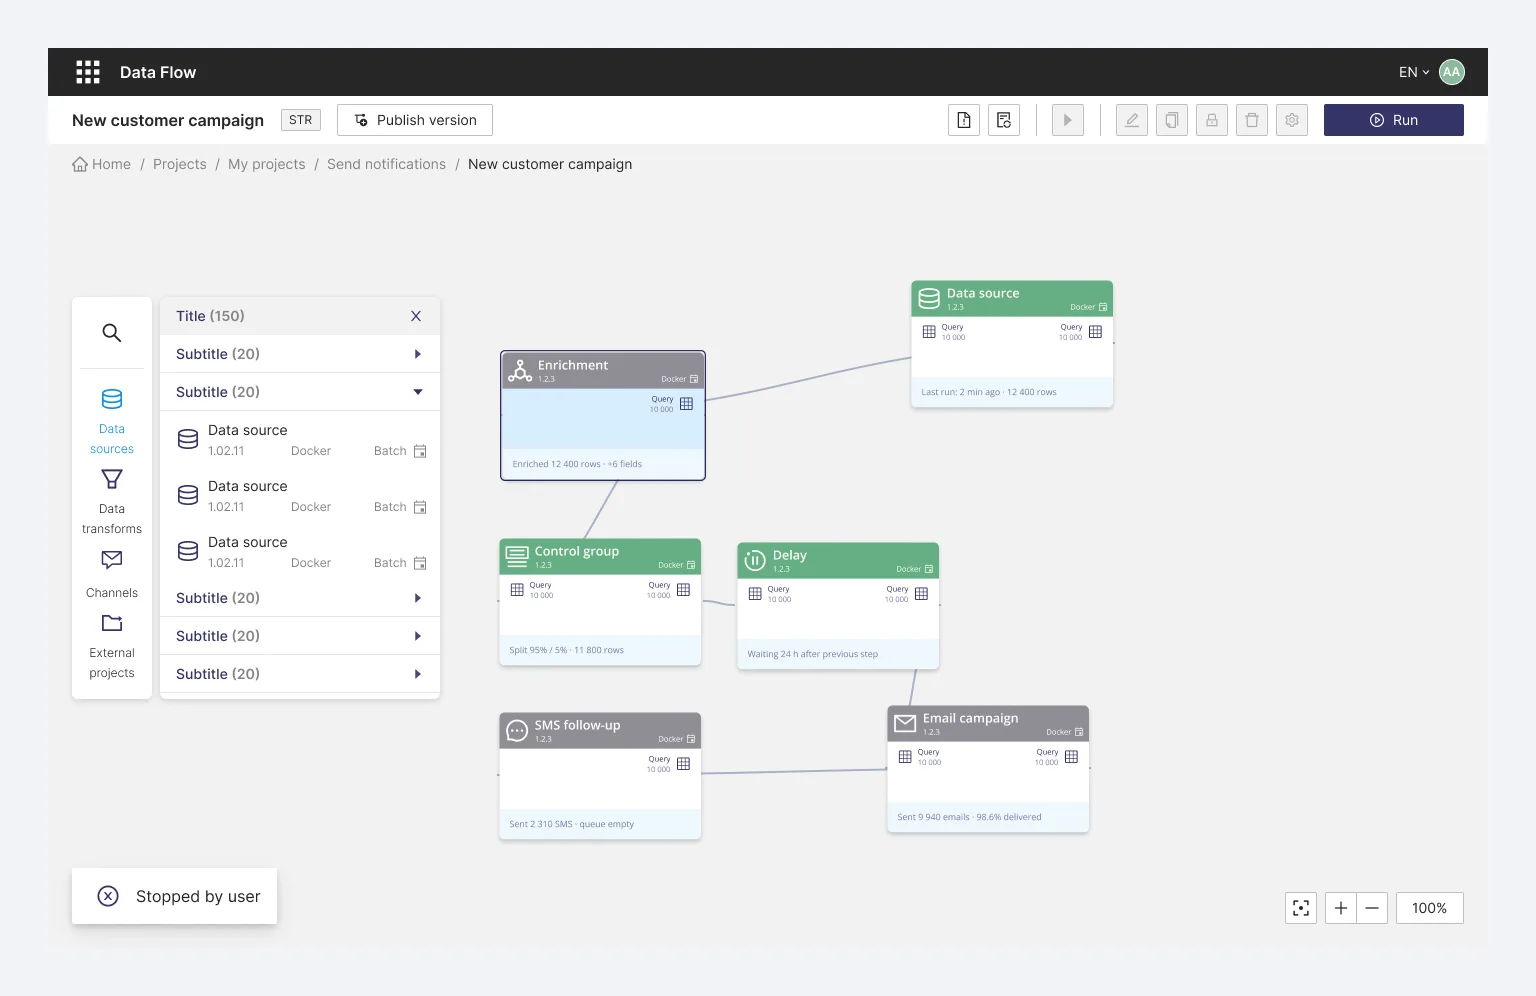
On the canvas itself, the node card does the talking. Each node carries its status in its header color and its last-run summary in its footer — so a flow of thirty nodes reads like a map, not a puzzle. The library panel sits on the canvas edge, organized by what blocks do: data sources, transforms, channels. Adding a block to a flow is a single drag.
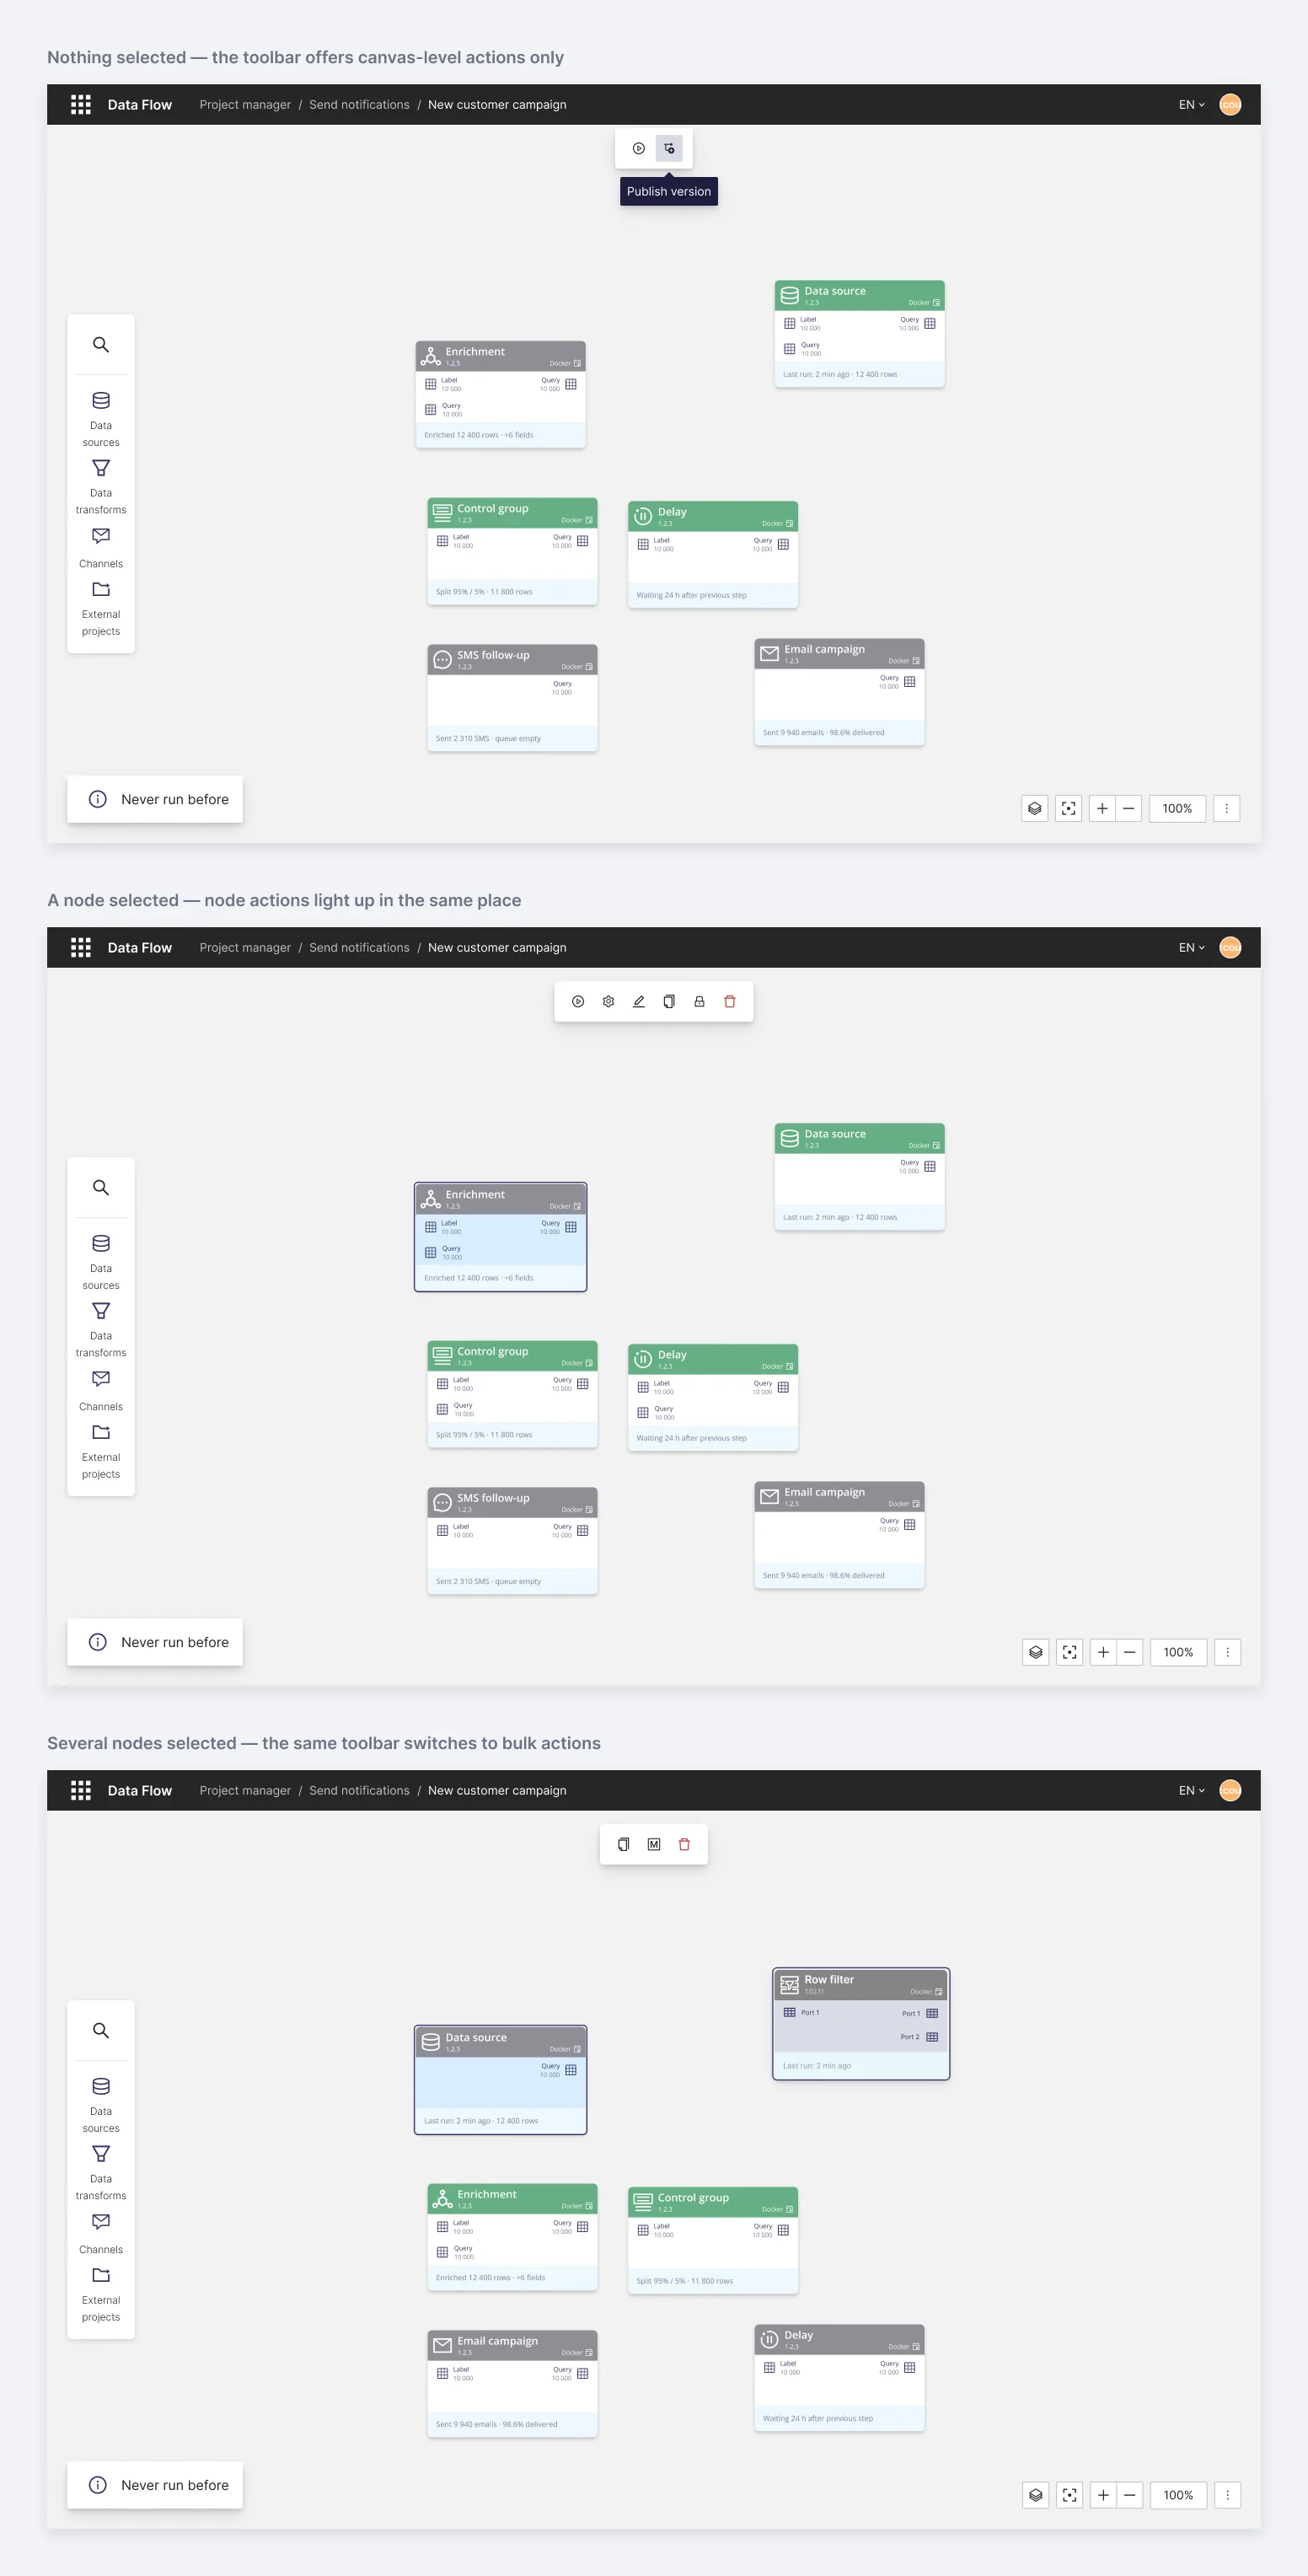
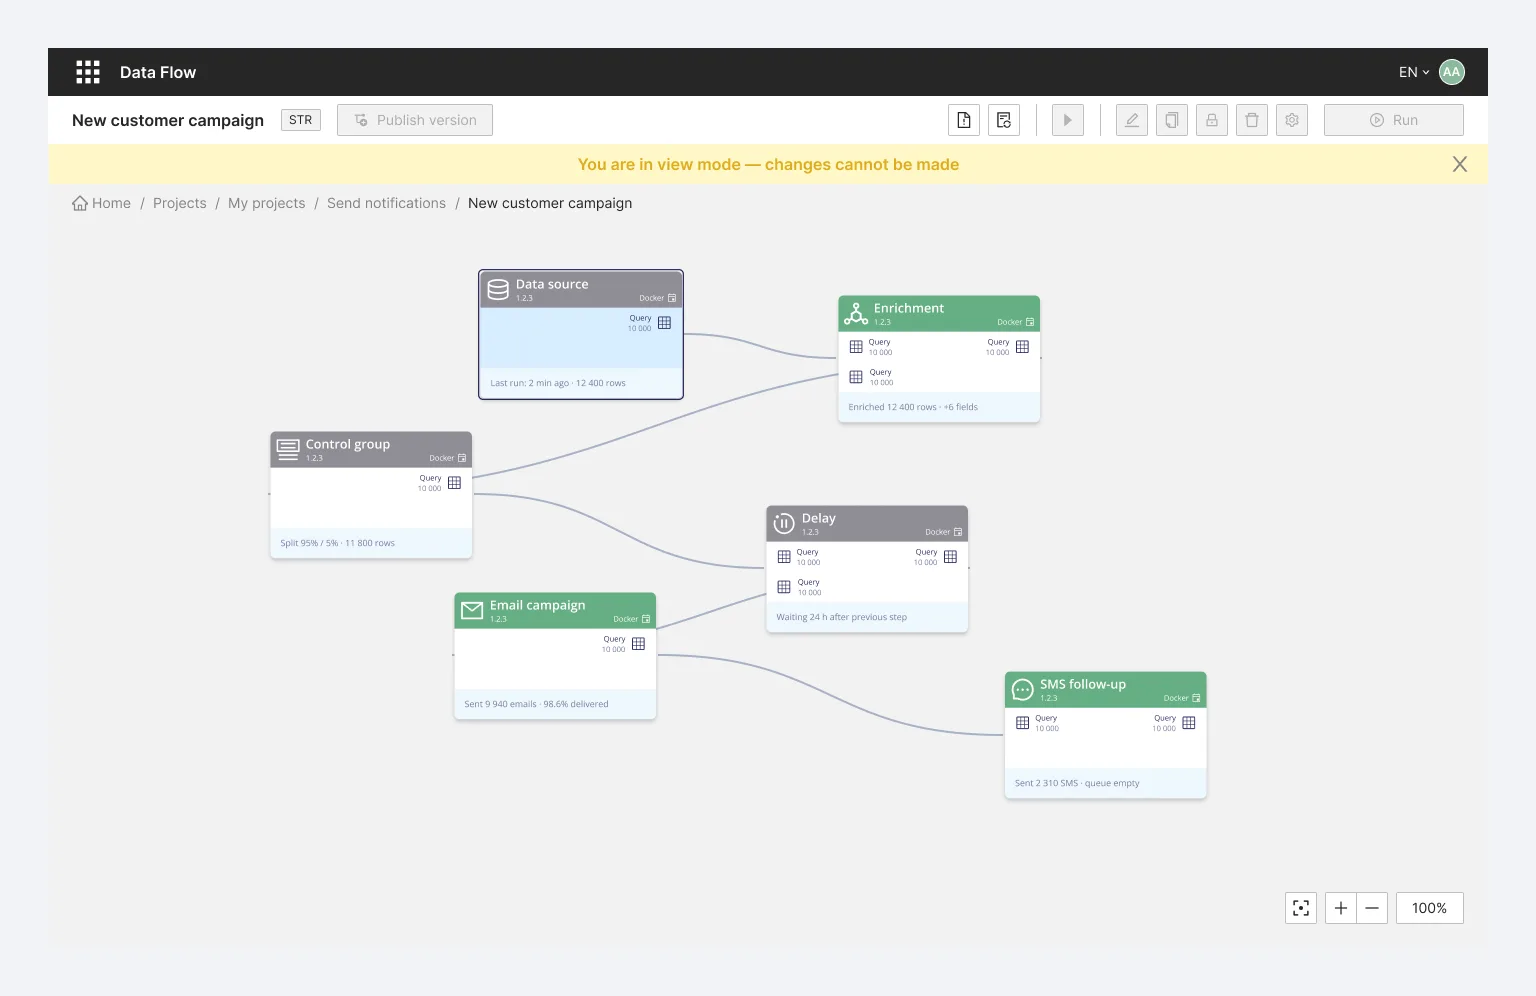
Actions live in one predictable place: the toolbar. It responds to what's selected — nothing, a node, a connector, several nodes — instead of scattering context menus around the canvas. The analyst always looks at the same corner of the screen to learn what they can do right now, and disabled buttons quietly explain what a selection doesn't allow.
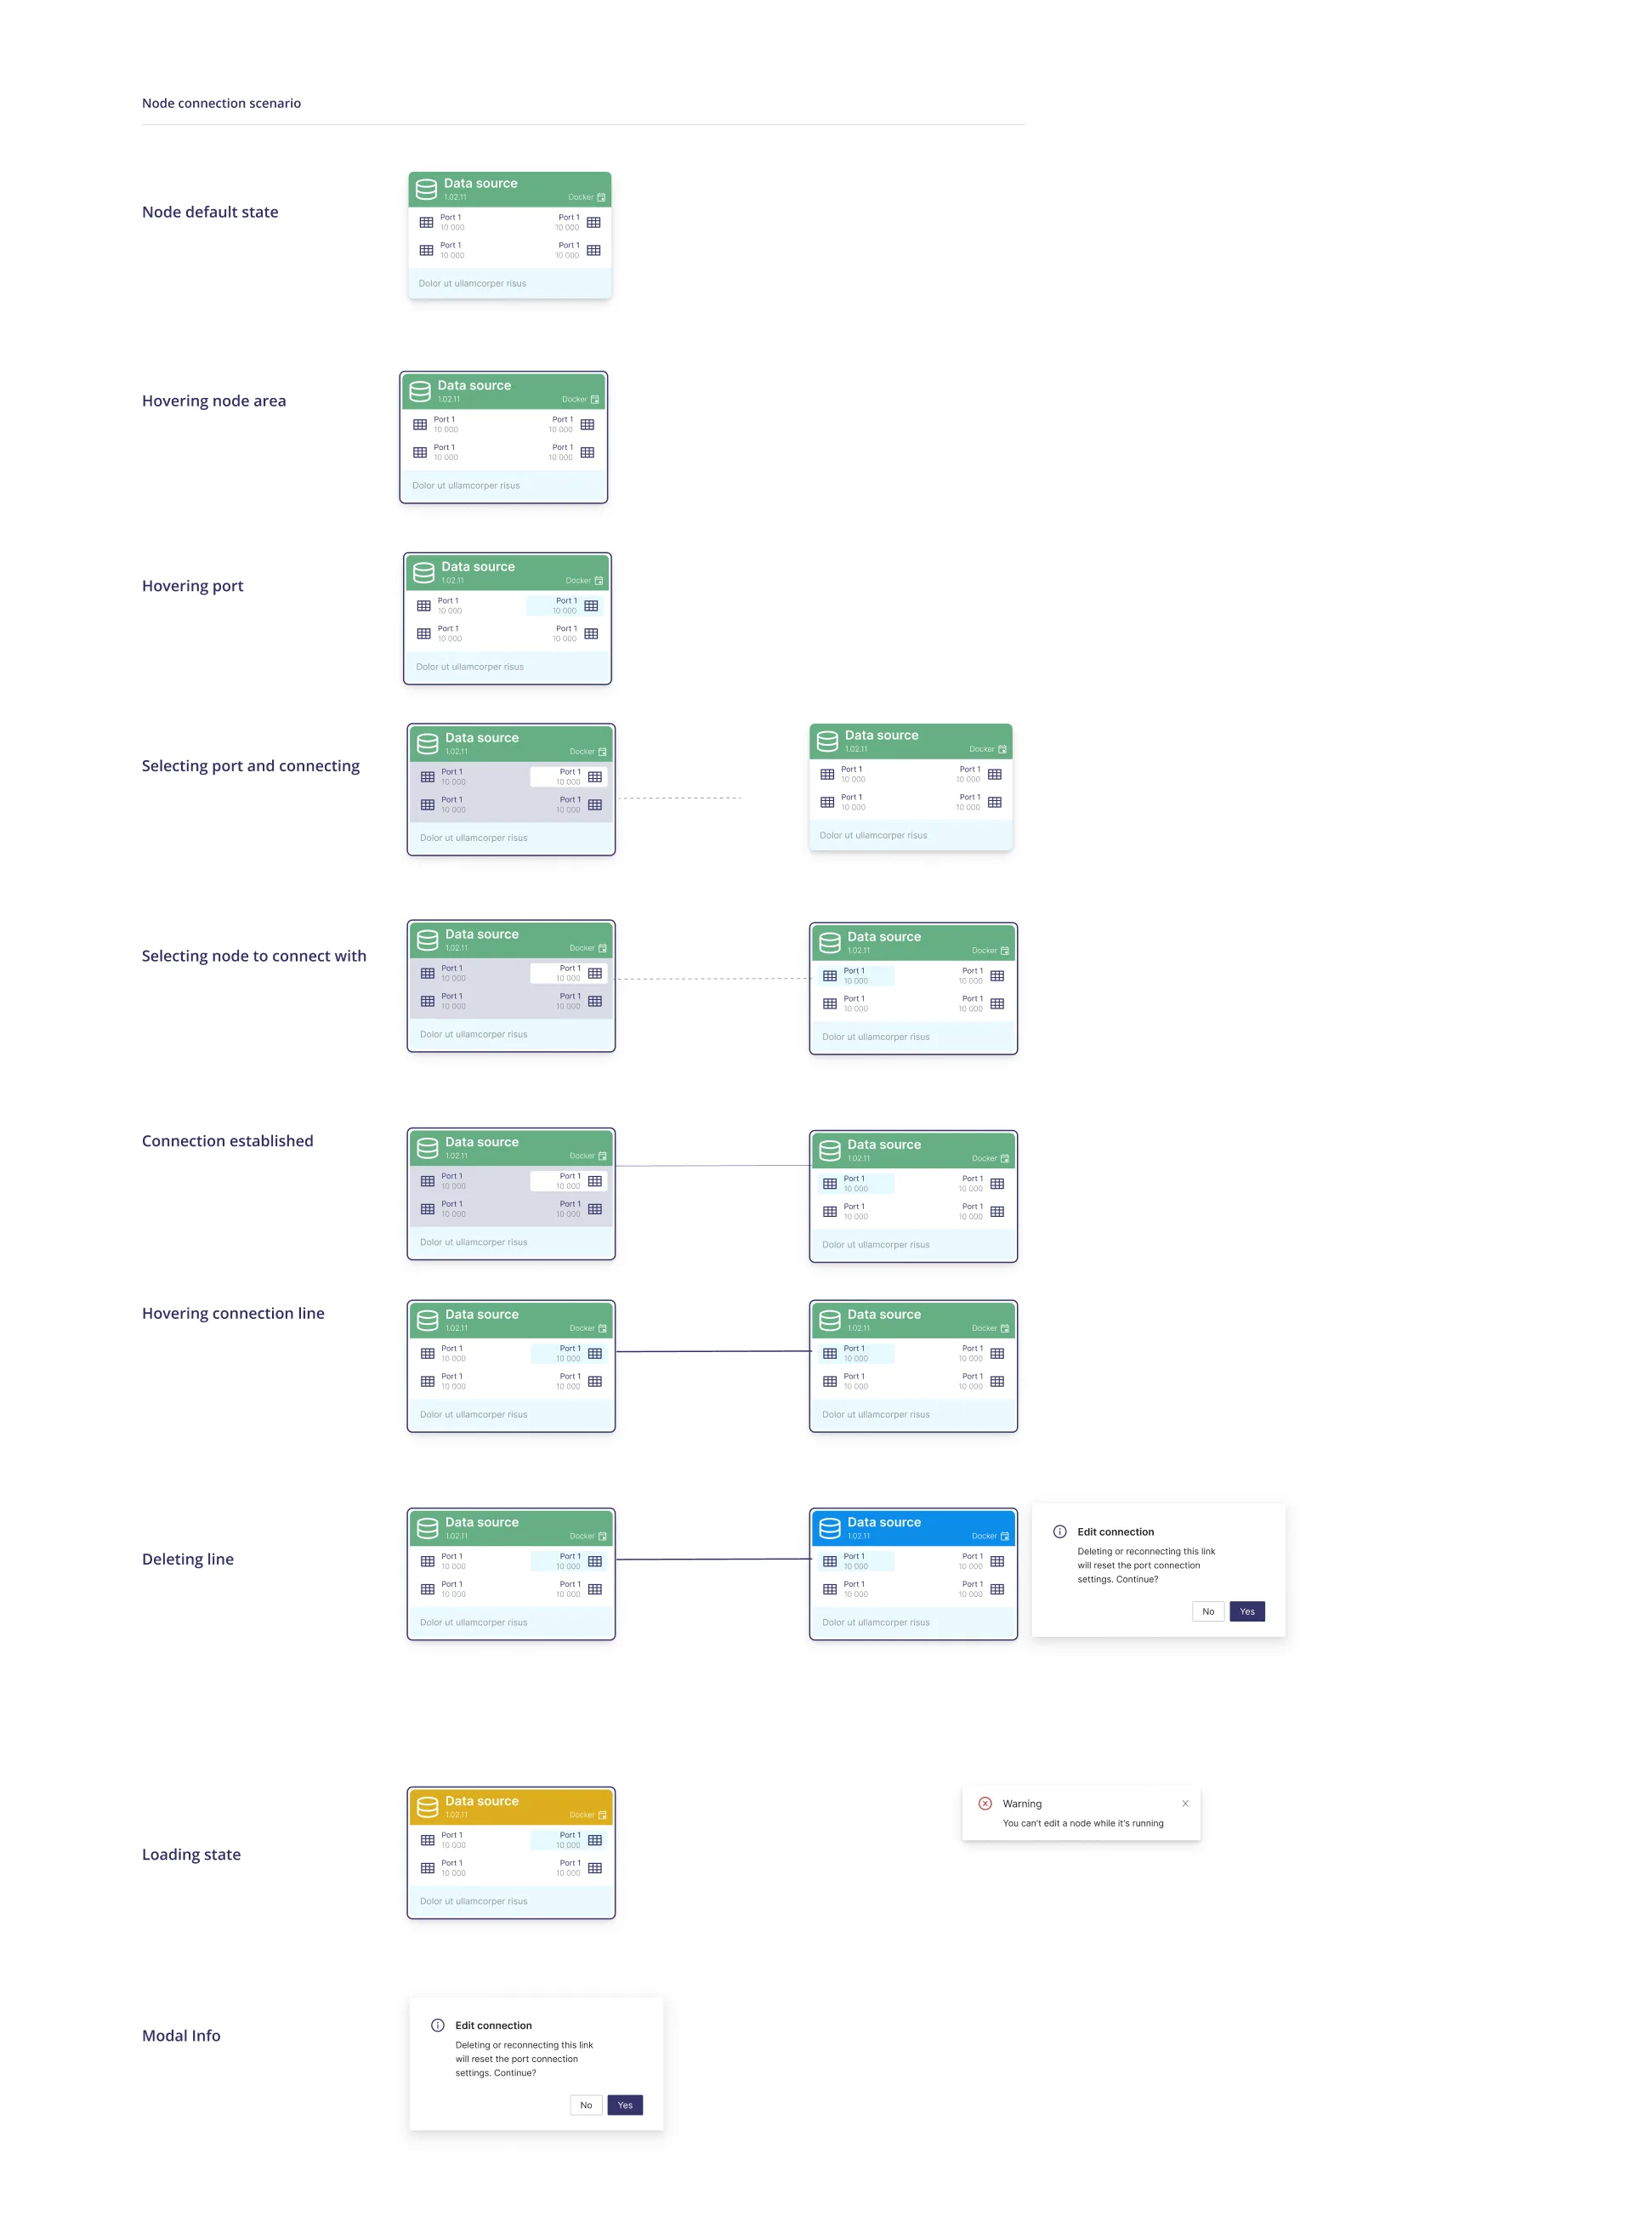
Connecting two nodes sounds trivial until you spec it: hover, port selection, the moment a link becomes real, deleting a line that carries settings. This scenario sheet documents every micro-interaction of a connection's life — including the warning that stops you from silently resetting port settings — and it's what the dev team built against.
The scariest moment in an automation tool is changing something that's live. We split the flow's life into drafts and published versions: the analyst edits a draft freely, publishes it as a numbered version, and the published version is what runs. Publishing is one explicit act with one clear confirmation — not a save button with side effects.
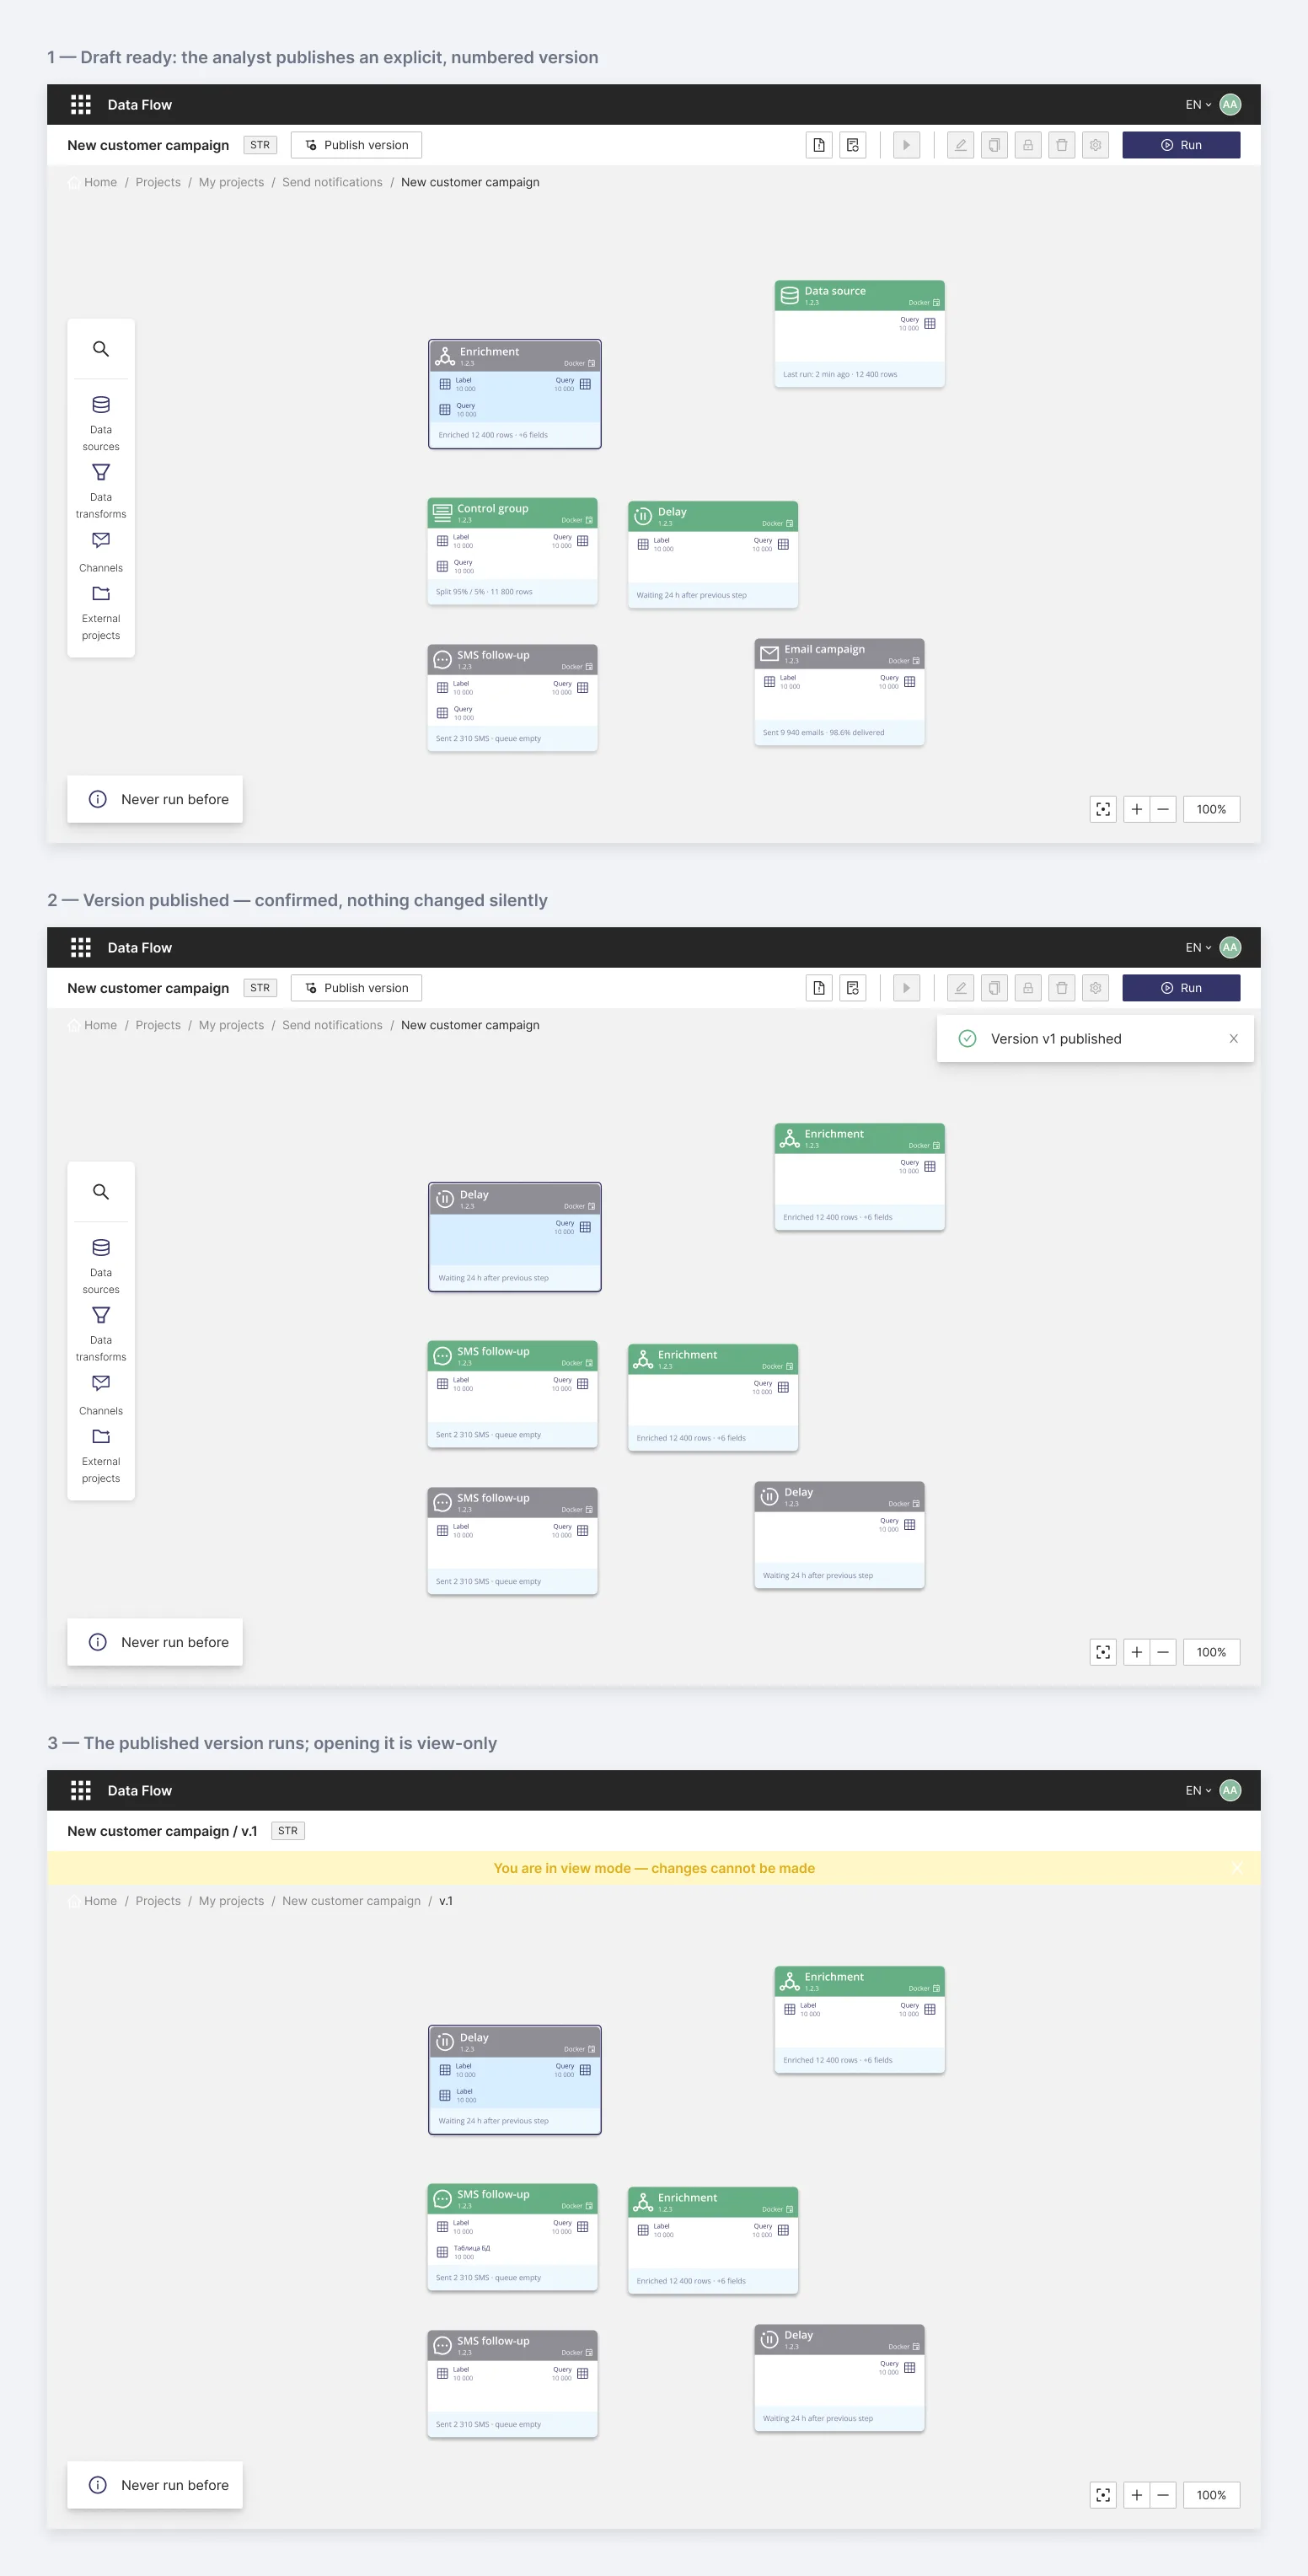
Opening a published version puts the whole canvas into view mode: a persistent banner says changes are impossible, editing controls are disabled, and attempts to modify a running node are stopped with an explanation. Colleagues can inspect exactly what's in production without any risk of nudging it.
Designing from real complaints kept the library page honest about what analysts needed, rather than what a catalog page usually has. And everything on the canvas is built from the design system documented in the companion case — the node cards, statuses, and toolbar patterns were specced once and reused here. That's also why this screen could afford the design attention it got: the foundations were already settled.
- 50+ block types assembled and configured on one canvas.
- ~10 layout iterations on the module library before it shipped.
- 6 selection states the toolbar responds to — from empty canvas to multi-node selection.
- 2 lives of every flow: an editable draft and numbered published versions that actually run.